
Preview




Description
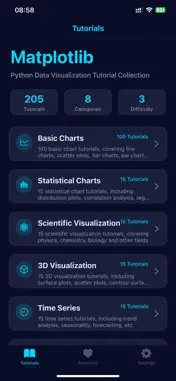
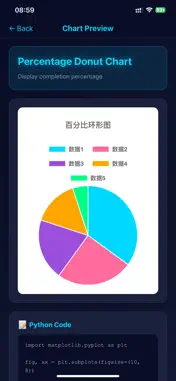
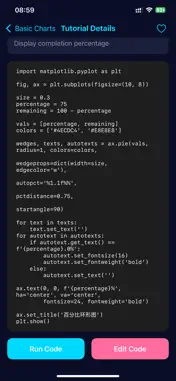
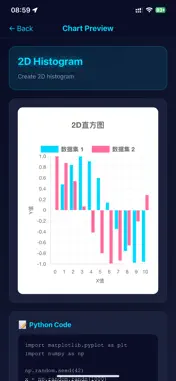
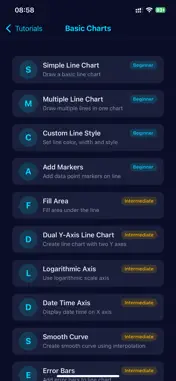
Why Choose Matplotlib Tutorial Guide? Want to create stunning data visualizations with Python? Matplotlib Tutorial Guide is your ultimate learning companion! Designed for data visualization enthusiasts, this app takes you from beginner to expert, helping you master essential Matplotlib skills with ease. Core Features: Comprehensive Tutorial System - Progressive learning from basic line charts to complex 3D visualizations - Covers 20+ chart types including line plots, scatter plots, bar charts, pie charts, heatmaps, and more - Each chapter includes detailed explanations and complete code examples - Markdown-formatted content with rich visuals for easy understanding Live Code Editor - Built-in Python code editing environment - Real-time chart rendering preview - Save and manage your code snippets - Export code files to iCloud Drive Visual Learning Experience - What-you-see-is-what-you-get chart preview - Support for multiple chart types with instant rendering - High-quality chart output for easy sharing and use Learning Progress Tracking - Automatically track your learning progress - Visual completion status display - Bookmark feature for quick navigation - Local data storage to protect your privacy Product Highlights: Completely Free - All tutorial content available at no cost, no hidden fees Ad-Free Experience - Focused learning without distractions Offline Access - Learn anytime, anywhere without internet connection Regular Updates - New tutorials and chart examples added regularly Privacy Protected - No user data collection, all learning records stored locally Perfect For: Python Beginners - Learn data visualization fundamentals systematically Data Analysts - Enhance chart creation skills Researchers - Create professional academic visualizations Students - Complete coursework and projects efficiently Data Visualization Enthusiasts - Explore endless chart possibilities Use Cases: - Learn tutorial chapters during your commute - Practice coding during study breaks - Quickly reference chart templates at work - Study offline at your favorite coffee shop Start Your Data Visualization Journey Today! Whether you're a programming novice or an experienced developer, Matplotlib Tutorial Guide helps you rapidly improve your data visualization skills. From simple line charts to complex multi-subplot layouts, from basic color schemes to professional chart styling, we've got it all covered. Download Matplotlib Tutorial Guide now and make data visualization simple, fun, and efficient!
Technical Analysis
Package Overview Basic metadata
Bundle ID
com.xiaoyan.MatplotlibGuide Current Version 1.0
Minimum iOS 16.6
Package Size App Store Size
Package Metadata 1 / 1 version records
Detailed binary, privacy-manifest, framework, and Info.plist results have not been indexed for this package yet. The verified App Store and archive metadata above remains available.
Known Version Records
1 version record with stored package metadata
Stored metadata does not guarantee a package is currently available to download.
| Details | Version / IDs | Version date | Action |
|---|---|---|---|
| 11.96 MB | v1.0 App Store ID: 885371762Build: 1.0 | 2026-05-09 00:18:11 | Paid / Arcade |
Sources and limitations
This page combines App Store catalog metadata, historical version records, and archived package scans where available. Ratings are from the App Store, and technical findings are observations rather than certifications. Data freshness, compatibility, availability, and analysis limitations apply.
Stored catalog source: USA App Store storefront. A catalog collection timestamp is not available on this page; displayed metadata is not a live availability, price, or installation check.