
Preview



Description
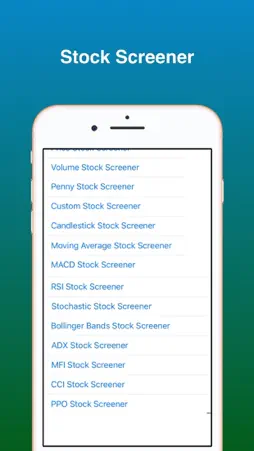
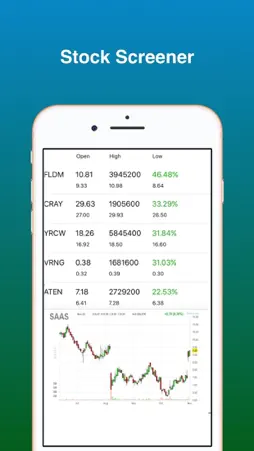
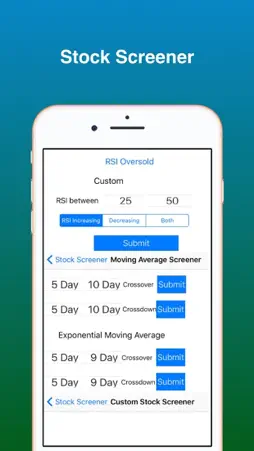
Stock screener pro allows you to combine multiple technical indicators and scan. This is the PRO version of our free stock screener app. It has all the features that the free version has. The differences in this PRO version is 1. The Stock Screener Pro allows you to combine multiple technical indicators and scan the stock market. This will save you a lot of time as you no longer need to scan technical indicator one by one. For example, you can search for stocks trading in the range of $5-$10 with volume 100,000-1,000,000 that formed a bullish engulfing pattern and a macd crossover with one shot. It takes only a few seconds to get you the result sets you desired. 2. Removed Ads Stock Screener search US stock market based on technical indicators which allows you to find trade setups to swing trade. This is an End of Day Technical Stock Screener, meaning the stock quote data is updated at the end of the day. We do not offer real time stock quotes for our stock screener. If you are a day trader, this app might not be useful. However, if you are a short term swing trader, you will find this stock screener app useful. There are a variety of technical indicators that you can scan the stock market for trading setups. You will find stocks to watch with our stock market screener. Our stock screener uses stock charts from Finviz. The stock charts uses intraday data which is delay by 15 minutes. This stock scanner scans for stocks based on technical indicators only, it does not care about the fundamental data like PE ratio. If you are looking for a fundamental stock screener, this app is not for you. Below is a list of the most popular stock chart patterns and technical indicators that you can use with our stock screener app. Daily Stock Gainers and Losers - You can find daily stock gainers and losers Price Stock Screener - allows you to search for stocks based on price. Volume Stock Screener - allows you to search for stocks based on volume moment. Penny Stock Screener - allows you to search for small cap stocks as well as penny stocks listed on NYSE, NASDAQ and AMEX. MACD Stock Screener - MACD is a popular technical indicator that are widely used by swing traders. Our MACD stock screener allows you to scan for MACD crossover, cross down patterns. Candlestick Stock Screener - Our candlestick stock screener allows you to scan for the most popular candlestick patterns. Many of these patterns are reversal patterns allowing you to jump on a trend early. RSI Stock Screener - allows you to find oversold and overbought stocks and stocks with RSI increasing or decreasing. Moving Average Stock Screener - Moving average crossovers generate bullish signal. You can add stocks to your watchlist when these crossover occurs. You can use both moving average and exponential moving average. Bollinger Band Stock Screener - Bollinger Band is a nice chart pattern to see when you should get in or get out from a stock. The idea is when the stock price moves above the upper bollinger band, it is time to sell. When the stock price moves above the lower bollinger band, it is time to buy. Stochastic Stock Screener - Stochastic can be use as a leading indicator when you use it to find overbought and oversold stocks. ADX Stock Screener - ADX is a technical indicator to measure the strength of a stock trend without regard to its direction. Our ADX screener gives you the ability to scan for stocks with strong trends. MFI Stock Screener - is a technical indicator that uses stock price and volume to measure buying and selling pressure. It can also be used to find oversold and overbought stocks. CCI Screener - Commodity Channel Index can be used to identify a new trend or warning of extreme conditions when a stock is overbought or oversold. CCI Stock Screener
What's New
Version 1.10 2026-08-29
minor bug fix and optimize code Technical Analysis
Package Overview Basic metadata
Bundle ID
com.stockscanner.stockmarket.StockScreenerPro Current Version 1.10
Minimum iOS 15.6
Package Size App Store Size
Package Metadata 1 / 6 version records
Detailed binary, privacy manifest, framework, and Info.plist results have not been indexed for this package yet. The verified App Store and archive metadata above remains available.
Developer Information
Known Version Records
1 version record with stored package metadata • 6 known version records
Stored metadata does not guarantee a package is currently available to download.
| Details | Version / IDs | Version date | Action |
|---|---|---|---|
| 8.56 MB | v1.6 App Store ID: 848738511Build: 1.6 | 2022-05-01 20:24:26 | Paid / Arcade |
| Not archived | App Store ID: 837418571 | Unknown | Paid / Arcade |
| Not archived | App Store ID: 835540998 | Unknown | Paid / Arcade |
| Not archived | App Store ID: 835448869 | Unknown | Paid / Arcade |
| Not archived | App Store ID: 824427168 | Unknown | Paid / Arcade |
| Not archived | App Store ID: 814541112 | Unknown | Paid / Arcade |