
Preview






Description
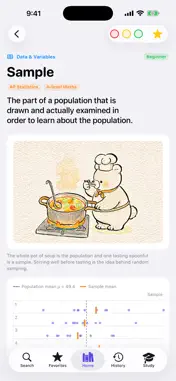
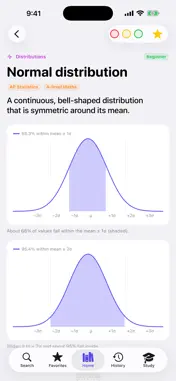
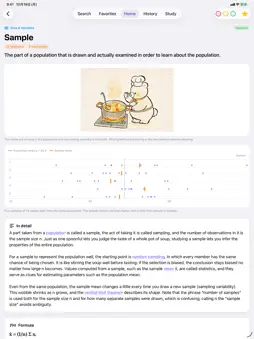
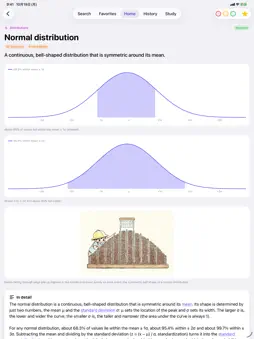
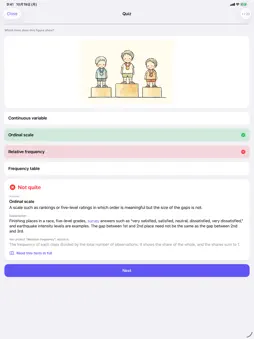
What does a p-value actually tell you? How is standard error different from standard deviation? Visual Statistics Glossary explains statistics one term at a time, with a chart and a picture for each. Definitions that slide right off the page in a textbook start to stick once you can see them. [434 terms] From the basics (mean, median, reading graphs) through probability distributions, estimation and hypothesis testing, regression, ANOVA, multivariate analysis, Bayesian statistics, time series, mathematical statistics, data science and machine learning, and official statistics, across 19 topics. There is also a section of laws and paradoxes worth telling your friends about, such as the Monty Hall problem and Simpson's paradox. [What each term includes] - A chart drawn from real numbers, for every term - An illustration that captures the idea at a glance (383 terms) - A one-line definition and a fuller plain-language explanation - The formula, with what each symbol means (where there is one) - An everyday example with numbers - Common mistakes - Key points for exams and practice - Related terms: any other term mentioned in the text is a link you can tap [Finding what you need] - Search by name - Browse by topic or A–Z - Filter by level: Beginner, Elementary, Intermediate, Advanced - Filter by exam: see which terms fall within AP Statistics or A-level Maths statistics - A Term of the Day on the home screen [Remember it] - Star your favorites and mark terms red, yellow or green, however you like - Every term you open is kept in your history - Cards: see a term, recall its meaning, and mark it Not yet / Unsure / Got it - Quiz (Full Version): read a definition and pick the term from four choices, or name the term shown in a chart or picture. Each question shows the answer and an explanation [Free and Full Version] 126 terms are free to read in full. For every other term you can still see the name and its one-line definition. The Full Version, a one-time purchase, gives you: - Charts and explanations for all 434 terms - Quizzes, and study sessions filtered by favorites or colors - Unlimited favorites and up to 500 history entries - Terms added later at no extra cost No subscription. No account needed. Ads appear only in the free version; the full version has none. [Great for] - Students in AP Statistics, A-level Maths, or a college intro stats course - Anyone working with data in research or a thesis - Analysts and marketers running A/B tests and reports - Anyone who wants to read the numbers in the news with a sharper eye [11 languages] English, Japanese, Korean, Chinese (Simplified and Traditional), Russian, German, French, Spanish, Hindi and Portuguese. Switch any time inside the app. Exam filters are an informal guide based on published course and specification content. AP is a registered trademark of College Board, which is not affiliated with and does not endorse this app. This app is not affiliated with the Department for Education or any exam board.
What's New
Version 1.1 2026-11-12
• The free version now shows an occasional ad after you have read a few terms. Buying the Full Version removes all ads. • Added “Ad Privacy Settings” in Setting...• The free version now shows an occasional ad after you have read a few terms. Buying the Full Version removes all ads. • Added “Ad Privacy Settings” in Settings (shown in regions where it applies). • Small improvements and stability fixes. Technical Analysis
Package Overview Basic metadata
Bundle ID
com.statzukan.statzukan Current Version 1.1
Minimum iOS 16.0
Package Size App Store Size
Package Metadata 0 / 0 version records
Detailed binary, privacy manifest, framework, and Info.plist results have not been indexed for this package yet. The verified App Store and archive metadata above remains available.
Developer Information
Known Version Records
0 version records with stored package metadata
Stored metadata does not guarantee a package is currently available to download.
| Details | Version / IDs | Version date | Action |
|---|