
Preview





Description
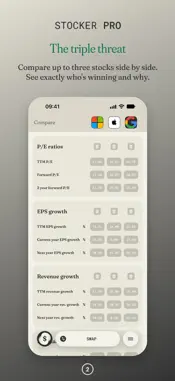
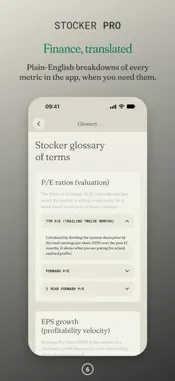
Research and compare stocks, build price targets, read company filings. No noise, no fluff – just the numbers that matter. COMPARE Put up to three stocks side by side: P/E ratios, earnings and revenue growth, margins and price-to-sales. Laid out so you can actually see what's going on. PROJECT Set your own growth assumptions and see what a stock could realistically be worth. Tweak the inputs, see the output. Your logic, your numbers. For US stocks, each input shows its typical range from the company's last 3 to 10 years of annual reports: how fast it has actually grown, and what the market has paid for it. Every stock has a price chart, from one month to its full history, with dividends and stock splits marked. FILINGS SEC Filings for US stocks, RNS announcements for UK-listed companies. Read the original document, not someone else's take on it. THE VAULT Save everything and come back to it. Your comparisons, projections and filings – all waiting exactly where you left them. THE MARKETS Over 12,000 US shares and ETFs across NASDAQ, NYSE and NYSE American, plus more than 1,600 London Stock Exchange and AIM companies. New listings appear the morning after they start trading. BASIC: FREE NASDAQ and NYSE · compare 2 stocks · 3 projections a month · SEC filings · Glossary LIFETIME: ONE-OFF PURCHASE Everything in Basic, without the limits. Adds NYSE American (AMEX), the London Stock Exchange and AIM, a third compare slot, UK filings, and the Vault to save everything. PRO Everything in Lifetime, plus whatever we ship next – real-time data, watchlists and more markets are on the list. Founding rate: it'll still be cheaper than most tools doing half of what this does, and your subscription is literally what makes those features possible. Prices are delayed. Stocker is a research tool, not investment advice. Built by FiHub. Terms of Use (EULA): https://www.apple.com/legal/internet-services/itunes/dev/stdeula/ Privacy Policy: https://www.notion.so/Stocker-Privacy-Policy-329aa659aaf780949dfdd67e62ddeefd
What's New
Version 1.2 2026-11-19
A faster, more complete Stocker /// Typical ranges Under each Projections box, US stocks now show how fast the company has actually grown its revenue and profi...A faster, more complete Stocker /// Typical ranges Under each Projections box, US stocks now show how fast the company has actually grown its revenue and profit, and the P/E the market has typically paid for it, over the last 3 to 10 years of its annual reports. An arrow shows whether it's speeding up or slowing down. Tap a range to use it. /// Price charts Every stock now has a price history chart, from one month to its entire history, with dividends and stock splits marked. Press and drag to see any day's price. /// Faster projections Projections now load with a single request, so stocks open noticeably faster. /// Hundreds more London stocks Over 440 London shares and ETFs have been added, including companies that listed this year, and London stocks now show their proper sector. The list now updates itself from the London Stock Exchange. /// New listings, the next morning New US listings now appear the morning after they start trading, and companies that stop trading are removed automatically. /// US ETFs Around 5,700 US funds, including SPY, QQQ and VOO, can now be found, each with its price chart. They have their own ETFs row under NASDAQ and NYSE. /// A cleaner stock list Warrants, units and rights, which have no company figures of their own, no longer clutter search and the sector lists. /// Prices you can trust Every price shows when it's from, with a dot that turns amber or red if it's getting old. London prices are shown in pounds rather than pence, and figures for companies that report in another currency are converted properly. /// Clearer about funds and SPACs Open an ETF or a blank-cheque company (SPAC) and Stocker now tells you what it is and shows its price chart, instead of empty rows. SPACs are labelled in the stock list and can't be added to Compare, since they have no company figures yet. Company names are also kept up to date as companies rename. /// Clearer loading Figures now shimmer while they load, and "N/A" only appears when a figure genuinely isn't available. /// More reliable Stocker now has backup sources for prices and currency rates, so it keeps working when one source has a bad day. If figures can't load, it says so. Figures you've opened before appear instantly while fresh ones load, and the market list opens straight away. /// Quality of life Search says "Searching…" while it looks instead of "No results". On the free plan, London, AIM and AMEX stocks show a lock in search, and the upgrade page lists what Pro adds. You can see when the stock list was last updated, tapping the Vault shows what Pro includes, and the home screen shows the right version number. /// Fixes The 2-year forward P/E in Compare now uses analysts' earnings estimates; it could show odd figures for companies with one unusual quarter. Technical Analysis
Package Overview Basic metadata
Bundle ID
com.fihub.Stocker Current Version 1.2
Minimum iOS 18.6
Package Size App Store Size
Package Metadata 0 / 2 version records
Detailed binary, privacy manifest, framework, and Info.plist results have not been indexed for this package yet. The verified App Store and archive metadata above remains available.
Developer Information
Known Version Records
0 version records with stored package metadata • 2 known version records
Stored metadata does not guarantee a package is currently available to download.
| Details | Version / IDs | Version date | Action |
|---|---|---|---|
| Not archived | App Store ID: 884274174 | Unknown | Request Version |
| Not archived | App Store ID: 883509494 | Unknown | Request Version |