
Preview





Description
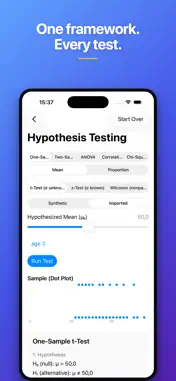
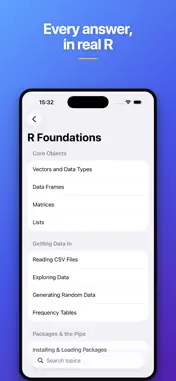
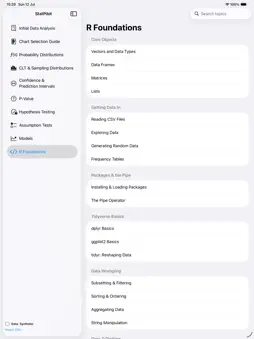
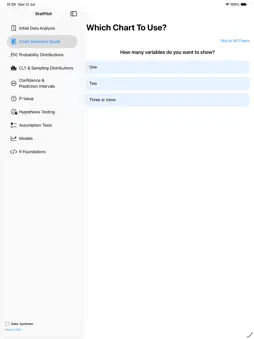
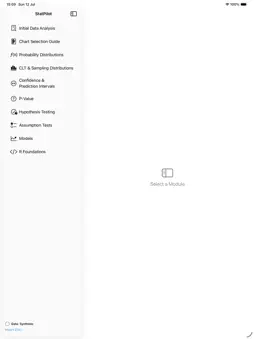
Stop memorizing formulas you don't understand. StatPilot is a hands-on statistics companion that lets you draw samples, run real tests, and watch the results build in real time — instead of just reading about them in a textbook. Every calculation is checked against R to machine precision, and every module shows you the equivalent R code, so what you learn here transfers directly to the software your course actually uses. WHAT'S INSIDE • Import your own CSV data — run real tests, models, and confidence intervals on your own dataset, not just synthetic examples, across nearly every module • Initial Data Analysis — explore a realistic messy dataset: missing values, duplicates, outliers, distribution shape • Chart Selection Guide — a decision tree that recommends the right chart for your data, with base R and ggplot2 code for each • Probability Distributions — 15+ discrete and continuous distributions with live, adjustable PDF/CDF charts • CLT & Sampling Distributions — watch the Central Limit Theorem happen, not just read about it • Confidence & Prediction Intervals — Wald, Wilson, exact, and bootstrap-t methods, side by side • Hypothesis Testing — t-tests, z-tests, ANOVA (including Welch's), chi-square, Fisher's Exact, Mann-Whitney, Wilcoxon, Kruskal-Wallis, correlation tests, and more • A guided "Which Test to Use?" decision tree for when you don't yet know the vocabulary • Assumption Tests — normality, equal variances, and regression diagnostics • Models — simple, multiple, and logistic regression with live model fitting • R Foundations — 25+ topics covering vectors, data frames, the tidyverse, and data wrangling, each with real R code and output THE FRAMEWORK Every hypothesis test in StatPilot walks through the same five steps: Hypotheses, Assumptions, Test Statistic, P-Value, Conclusion. Once you've seen it once, you've seen the shape of every test — the specifics change, the structure doesn't. WHO IT'S FOR Students in intro or intermediate statistics, biostatistics, or data science courses — especially if your course uses R. Also useful as a fast, visual refresher if it's been a while since your last stats class. Built for iPhone, iPad, and Mac. One-time purchase — no subscription, no ads, no in-app purchases.
What's New
Version 1.0.1 2026-08-03
New in this version: • Assumption Tests module — normality, equal variances, and regression diagnostics • Chart Selection Guide — a decision tree that recommend...New in this version: • Assumption Tests module — normality, equal variances, and regression diagnostics • Chart Selection Guide — a decision tree that recommends the right chart, with base R and ggplot2 code • Initial Data Analysis module for exploring messy, realistic datasets • R Foundations — 25+ topics on vectors, data frames, the tidyverse, and data wrangling • Guided onboarding and a clearer explanation of p-values Plus bug fixes and polish. Technical Analysis
Package Overview Basic metadata
Bundle ID
com.LN.statpilot Current Version 1.0.1
Minimum iOS 16.0
Package Size App Store Size
Package Metadata 0 / 0 version records
Detailed binary, privacy manifest, framework, and Info.plist results have not been indexed for this package yet. The verified App Store and archive metadata above remains available.
Known Version Records
0 version records with stored package metadata
Stored metadata does not guarantee a package is currently available to download.
| Details | Version / IDs | Version date | Action |
|---|