
Preview







Description
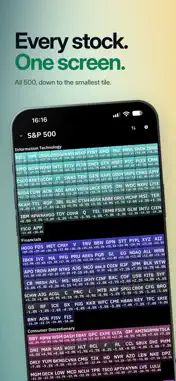
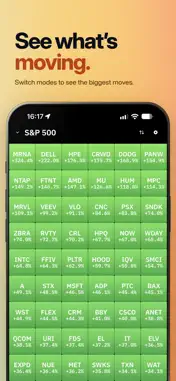
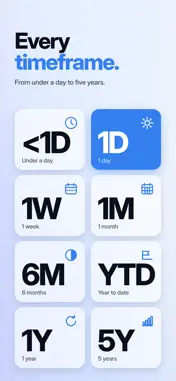
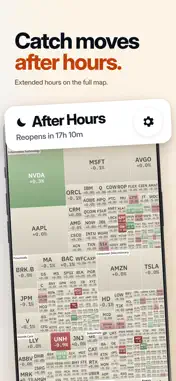
See the entire U.S. market in one view. Tilely turns the S&P 500, Dow, NASDAQ-100, and Russell 2000 into a living hierarchical heat map. Sectors first, stocks inside. Tile size tracks market cap. Color shows performance: green, grey, red. Tap any sector to zoom in. Scroll between industries. Switch between Market Cap, Equal Grid, RSI, and Volatility modes when you care about momentum or risk instead of size. Open any stock and get a clean detail card with sticky price and percent change. Dive into charts with candles, SMA 20/50/200, volume, RSI, and MACD, all controlled with one and two finger gestures. Star what matters. Your Watchlist becomes a focused grid when the full map is too much. Search any U.S. ticker or company name (brand aliases included). Jump between Extended Hours, 1D, 1W, 1M, YTD, 1Y, and 5Y with a single row of duration chips. No clutter. No brokerage noise. Just the map and the chart. Built for people who want to understand the market at a glance and go deeper the moment something moves.
What's New
Version 2.4 2026-11-11
Your portfolio, mapped Add shares and an average cost to the names in any custom list. Once every name has shares, the list becomes a treemap sized by the valu...Your portfolio, mapped Add shares and an average cost to the names in any custom list. Once every name has shares, the list becomes a treemap sized by the value of each position. Tap My ROI in the duration bar to color each tile by your return on cost. Import and export your lists as a CSV to move them between devices. No account needed. New Mono appearance A calm paper-and-ink theme that shows your market moves in shades of stone and graphite. Redesigned Lists Clearer columns for showing, renaming and reordering pages, and hidden pages are skipped on the map. A simpler list editor: tap a name to edit its holdings, swipe to move or remove it. Stocks you add from search now keep their correct sector. Smoother and more polished A new tile-to-detail animation, softer lighting and crisper type. Prices and percentages roll into place as they update. Switching durations fades between colors without a reload flash. Custom lists load without flicker or stale data. A new button flips the treemap so the largest companies sit at the bottom. More distinct sector colors. Cleaner charts with better-spaced axes and smoother Volume, RSI and MACD panels. A tidier layout and chart sizing on iPad. Clear offline messages with a Retry button for search and market data. Technical Analysis
Package Overview Basic metadata
Bundle ID
lettdesigns.tilely.app Current Version 2.4
Minimum iOS 17.0
Package Size App Store Size
Package Metadata 0 / 0 version records
Detailed binary, privacy manifest, framework, and Info.plist results have not been indexed for this package yet. The verified App Store and archive metadata above remains available.
Developer Information
Known Version Records
0 version records with stored package metadata
Stored metadata does not guarantee a package is currently available to download.
| Details | Version / IDs | Version date | Action |
|---|